By The Numbers: Are WHIP, ERA, OBP More Important Than Average & Homers?
By Father Gabe Costa
» More Columns
It's fun to play with statistics.
I guess if there is anything in baseball that's akin to alchemy's quest to turn base metals into silver or gold, it would be to find a magic formula which would predict victories on the field.
For this edition of By The Numbers, I decided to look at seven measures (five on offense and two on defense) to see how they were "correlated" to wins. That is, I looked at each team's regular-season victory total for last year (2013) and compared them with certain seasonal totals. I then determined a "regression equation" and a corresponding "coefficient of determination."
To give a basic Statistics 101 review, a regression equation represents a line (usually a straight line) which "best fits" a set of data. The equation's parameters (which are determined by applying differential calculus) are given in terms of a slope and a y-intercept. For example, the equation y = 3x + 5 has a slope of 3 and a y-intercept of 5.
The coefficient of determination, denoted by R2, is a number between 0 and 1. The nearer it is to 1, the better the "fit."
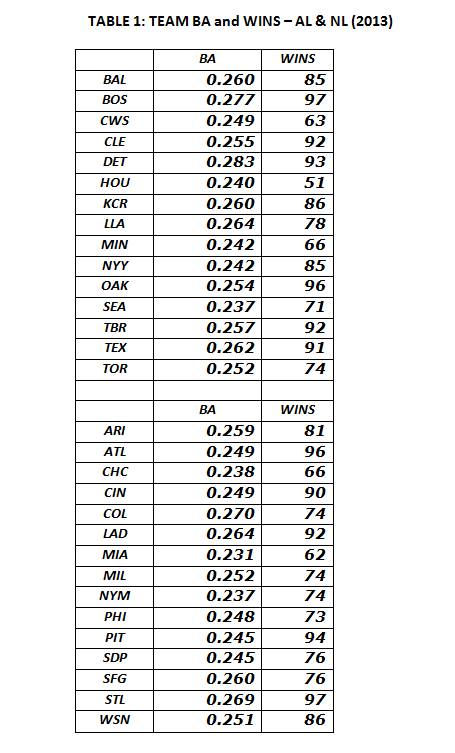
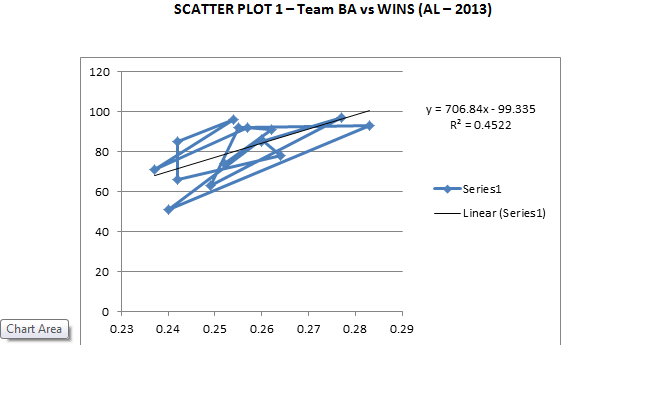
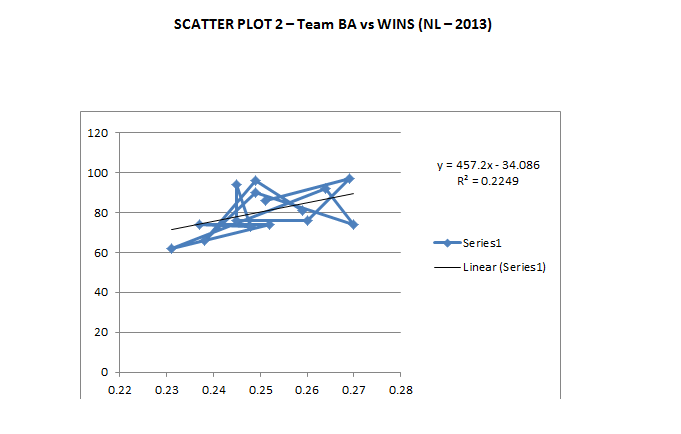
The table below (Table 1) gives the team batting averages (BA) and corresponding wins. And below this table are the corresponding "scatter plots" for the American League and the National League.
Note the corresponding regression equations and coefficients of determination in the upper right-hand corner of each scatter plot.
By the way, if a regression equation is "good enough," it is sometimes used as an instrument to predict a result. For example, let's assume an AL team hit .255 during the 2013 season; then, based on the regression equation y = 706.84x – 99.335, the "predicted" or "expected" number of wins would be given by the calculation: 706.84 * (.255) – 99.335 = 81 (approximately).
The other comparisons were made with home runs (HR), total bases (TB), on-base-plus slugging (OPS), on-base percentage (OBP), walks-plus-hits-per-inning pitched (WHIP) and earned-run average (ERA). The results are given in Table 2 below.
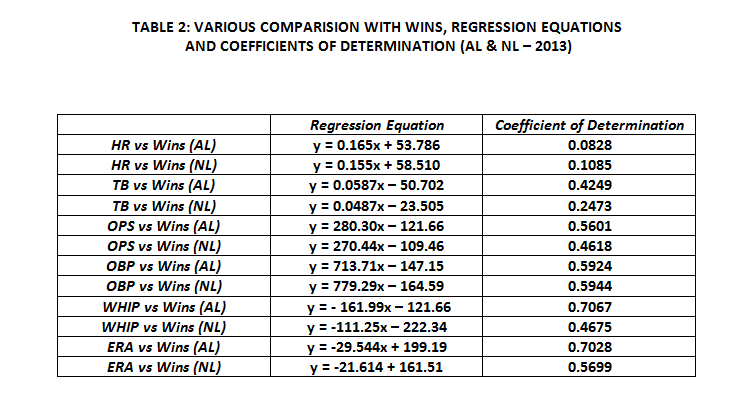
Notice that, in general, based on this one year there is a much "stronger correlation" with measures such as WHIP, ERA and OBP as opposed to HR or BA.
What do you think? Should teams focus on WHIP, ERA and OBP rather than BA and HR?
You May Also Be Interested In These Stories